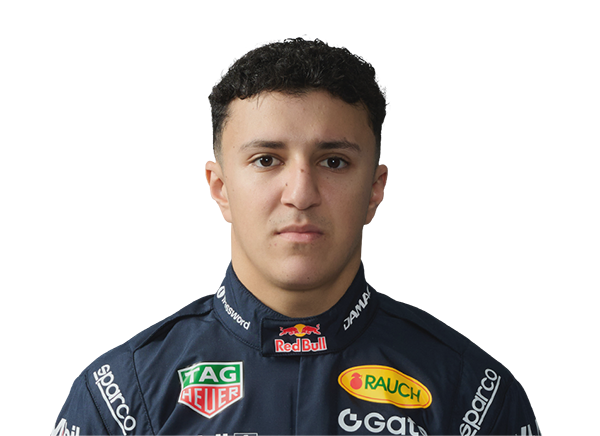
Isack Hadjar
 France
Career totals from published race classifications (1950–2026). Poles use the qualifying classification where published, otherwise grid position 1. Sum of points scored per race and sprint as published; pre-1991 seasons with dropped scores differ from official championship totals.
Profile
Driver DNA · 2025–2026 · f1-dna-1.0.0 · as of 2 Oct 2026
Qualifying Pace
Highn=33 · vs 24 drivers (2025–2026)
median teammate qualifying gap (%), sign inverted
- teammate gap pct median
- -0.103
- teammate gap samples
- 33
- teammate h2h
- 21-15
- q3 rate
- 76.5%
- pole rate
- 0.0%
- front row rate
- 0.0%
Race Result vs Teammate
Highn=35 · vs 24 drivers (2025–2026)
share of races finishing ahead of teammate (one-car retirements count for the finisher)
- teammate race h2h
- 18-17
- avg finish delta when both classified
- 0.16
Positions Gained
Highn=31 · vs 23 drivers (2025–2026)
mean grid-to-finish gain above the expectation for that grid slot (classified finishes)
- mean positions gained
- -0.226
- expectation adjusted
- -0.677
Finishing
Highn=36 · vs 23 drivers (2025–2026)
classification rate minus teammate classification rate (same car); any retirement cause counts
- classification rate
- 86.1%
- teammate classification rate
- 80.6%
- retirements
- 5
Consistency
Highn=33 · vs 23 drivers (2025–2026)
spread (std dev) of teammate qualifying gaps; lower spread ranks higher
- teammate gap std pct
- 0.425
- finish position std
- 4.283
Team Points Share
Highn=27 · vs 21 drivers (2025–2026)
share of the team's points in events where the team scored
- points
- 137
- team points
- 305
- points per start
- 3.806
Street Circuits
Lown=7 · vs 23 drivers (2025–2026)
teammate qualifying gap on street layouts relative to the driver's overall gap (positive = relatively stronger)
- teammate gap pct median
- -0.29
- overall gap pct median
- -0.103
High-Speed Circuits
Mediumn=13 · vs 23 drivers (2025–2026)
teammate qualifying gap on high pole-lap-speed circuits relative to the driver's overall gap (positive = relatively stronger)
- teammate gap pct median
- -0.096
- overall gap pct median
- -0.103
Low-Speed Circuits
Mediumn=12 · vs 24 drivers (2025–2026)
teammate qualifying gap on low pole-lap-speed circuits relative to the driver's overall gap (positive = relatively stronger)
- teammate gap pct median
- -0.083
- overall gap pct median
- -0.103
Career DNA · career, all eras · f1-dna-1.0.0 · as of 2 Oct 2026
Qualifying Pace
Highn=33 · vs 582 drivers (career, all eras)
median teammate qualifying gap (%), sign inverted
- teammate gap pct median
- -0.103
- teammate gap samples
- 33
- teammate h2h
- 21-15
- q3 rate
- 76.5%
- pole rate
- 0.0%
- front row rate
- 0.0%
Race Result vs Teammate
Highn=35 · vs 539 drivers (career, all eras)
share of races finishing ahead of teammate (one-car retirements count for the finisher)
- teammate race h2h
- 18-17
- avg finish delta when both classified
- 0.16
Positions Gained
Highn=31 · vs 321 drivers (career, all eras)
mean grid-to-finish gain above the expectation for that grid slot (classified finishes)
- mean positions gained
- -0.226
- expectation adjusted
- -0.677
Finishing
Highn=36 · vs 375 drivers (career, all eras)
classification rate minus teammate classification rate (same car); any retirement cause counts
- classification rate
- 86.1%
- teammate classification rate
- 80.6%
- retirements
- 5
Consistency
Highn=33 · vs 79 drivers (career, all eras)
spread (std dev) of teammate qualifying gaps; lower spread ranks higher
- teammate gap std pct
- 0.425
- finish position std
- 4.283
Team Points Share
Highn=27 · vs 290 drivers (career, all eras)
share of the team's points in events where the team scored
- points
- 137
- team points
- 305
- points per start
- 3.806
Street Circuits
Lown=7 · vs 72 drivers (career, all eras)
teammate qualifying gap on street layouts relative to the driver's overall gap (positive = relatively stronger)
- teammate gap pct median
- -0.29
- overall gap pct median
- -0.103
High-Speed Circuits
Mediumn=13 · vs 78 drivers (career, all eras)
teammate qualifying gap on high pole-lap-speed circuits relative to the driver's overall gap (positive = relatively stronger)
- teammate gap pct median
- -0.096
- overall gap pct median
- -0.103
Low-Speed Circuits
Mediumn=12 · vs 83 drivers (career, all eras)
teammate qualifying gap on low pole-lap-speed circuits relative to the driver's overall gap (positive = relatively stronger)
- teammate gap pct median
- -0.083
- overall gap pct median
- -0.103
Teammate record
| Teammate | Team | Seasons | Quali H2H | Race H2H | |
|---|---|---|---|---|---|
Max Verstappen VER | Red Bull Racing | 2026 | 4–8 | 3–9 | Battle |
Yuki Tsunoda TSU | Racing Bulls | 2025 | 1–1 | 1–1 | Battle |
Liam Lawson LAW | Racing Bulls | 2025 | 16–6 | 14–7 | Battle |
Recent races
| Season | Event | Team | Quali | Grid | Finish | Pts |
|---|---|---|---|---|---|---|
| 2026 | Azerbaijan Grand Prix | Red Bull Racing | 4 | 4 | 3 | 15 |
| 2026 | Hungarian Grand Prix | Red Bull Racing | 8 | 8 | 6 | 8 |
| 2026 | Belgian Grand Prix | Red Bull Racing | 10 | 21 | 6 | 8 |
| 2026 | British Grand Prix | Red Bull Racing | 5 | 5 | 5 | 10 |
| 2026 | Austrian Grand Prix | Red Bull Racing | 8 | 8 | 6 | 8 |
| 2026 | Barcelona-Catalunya Grand Prix | Red Bull Racing | 6 | 6 | 6 | 8 |
| 2026 | Monaco Grand Prix | Red Bull Racing | 5 | 5 | 3 | 15 |
| 2026 | Canadian Grand Prix | Red Bull Racing | 7 | 7 | 5 | 10 |
| 2026 | Miami Grand Prix | Red Bull Racing | 22 | 22 | DNF | |
| 2026 | Japanese Grand Prix | Red Bull Racing | 8 | 8 | 12 | |
| 2026 | Chinese Grand Prix | Red Bull Racing | 9 | 9 | 8 | 4 |
| 2026 | Australian Grand Prix | Red Bull Racing | 3 | 3 | DNF |
By season
| Year | Team | Starts | W | Pod | Poles | Pts | Pos |
|---|---|---|---|---|---|---|---|
| 2026 | Red Bull Racing | 12 | 0 | 2 | 0 | 86 | 8th |
| 2025 | Racing Bulls | 24 | 0 | 1 | 0 | 51 | 12th |